Econographicology
History of Graphs in EconomicsWhat is Econographicology ?
History of Graphs in Economics
In the evolution of the application of graphical representations in economics, so far two systems of Cartesian planes have been used: basic analytical Cartesian plane system based on 2-D graphs and complex analytical Cartesian plane system under 3-D graphs and Cartesian plane. The basic analytical Cartesian plane system was first used in the XIX century. It started with Antoine Augustin Cournot�s work, where mathematics began to be used in Economics. Basic analytical graph system emerged from the Utility Theory and was introduced by innovator economists William Stanley Jevons, Leon Walras, Vilfredo Pareto, Alfred Marshall and Francis Ysidro Edgeowrth over time. (McClelland, 1975)
The complex analytical Cartesian plane system has its origin in the XX century. It started with the introduction of sophisticated mathematics techniques in the development of new economic models. Calculus, Trigonometry, Geometry, statistical and forecasting methods are employed in these graphs. 3-Dimensional graphs and Cartesian plane (3-D) are also part of the complex analytical Cartesian plane system and applied in economic research. (Ovondo-Bodino, 1963)
2-D and 3-D graphs and Cartesian planes have been applied in the following economic models: General equilibrium and Welfare Theory (John R. Hicks), IS-LM Curve (Alvin H. Hansen), Development of Economic Theory: Static and Dynamic Analysis, (Paul A. Samuelson), Econometrics (Lawrence R. Klein), Phillips Curve (Alban W. Phillips), Okun Law (Arthur M. Okun), Economic Growth Theory (Robert M. Solow), Game Theory (John F. Nash and John von Neumann), Introduction of Dynamic Models and Econometrics (Jan Tinbergen), Monetary Theory (Milton Friedman), Rational Expectations Theory (Robert J. Barro).
High technology and sophisticated instruments of analysis such as the electronic calculator and the computer facilitated the rapid development of complex analytical Cartesian plane system. The development of the instruments of analysis in economics took place in two stages. The first stage involved the �Basic Computational Instruments�, where electronic calculators were used to compute basic mathematical expressions (e.g. long arithmetic operations, logarithm, exponents and squares). This took place between the 1950�s and 1960�s.
The second stage of development took place in the middle of the 1980�s. This is when high speed and storage-capacity computers with sophisticated software were introduced for first time. The application of sophisticated software enables easy information management and the application of difficult simulations as well as the creation of high resolution under 3-D graphs and Cartesian plane. These instruments contributed substantially to the development and research of economics. Each of the Basic Analytical Space System and Complex Analytical Cartesian plane System can be categorized according to functions or dimensions. In terms of functions, the Cartesian planes are either descriptive or analytical. In terns of dimensions, the graph can be either 2-D or 3-D Cartesian planes.
In descriptive graphs, arbitrary information is used to observe the effect of theories. Analytical graph, on the other hand, are time-series graphs, cross-section graphs and scatter diagrams. In the case of analytical graphs, statistical data is used to show trends and relationships between two or more variables. The analytical focus of the graphical representations is supported by the application of high computational instruments based on sophisticated hardware and software.
Based on one hundred (100) papers published in twenty one (21) prestigious economic journals(*) between 1940�s and 2004 (JSTOR, 2004), we could observe that the common types of graphical representations applied in the study of social sciences, especially in economics, were the 2-Dimensional graphs and Cartesian plane. We found that the 99% of the papers applied 2-D Cartesian plane, and only 1% of the papers applied 3-D Cartesian plane. In view of that, this research is interested in presenting a new type of Cartesian Spaces: Multi-dimensional Cartesian Space (MD), Infinity Dimensional Cartesian Space (ID) and Multi-Functional Cartesian Space, which enables economists to analyze economic phenomena from multiple perspectives in time and space.
(*) American Economic Review, Canadian Journal of Economics, Econometrica, Economic History Review, Economic Journal, International Economic Review, Journal of Economic History, Journal of Economic Literature, Journal of Political Economy, Oxford Economic Papers, Quarterly Journal of Economics, Review of Economic Studies, Review of Economics and Statistics, Canadian Journal of Economics and Political Science, Journal of Economic Abstracts, Contributions to Canadian Economics, Journal of Labor Economics, Journal of Applied Econometrics, Journal of Economic Perspectives, Publications of the American Economic Association, Brookings Papers on Economic Activity. Microeconomics and American Economic Association Quarterly.
What is Econographicology?
Econographicology developed due to the necessity to generate an alternative and specialized analytical tool in economics focused on the specific study of uses and design of graphics representations, such as graphs, diagrams, schemes, prototypes and maps. Therefore, the general objective of Econographicology is to maximize the use of graphics representations to minimize difficulties in the process of research and teaching-learning of economics and other areas related to economics such as business, management and finance.
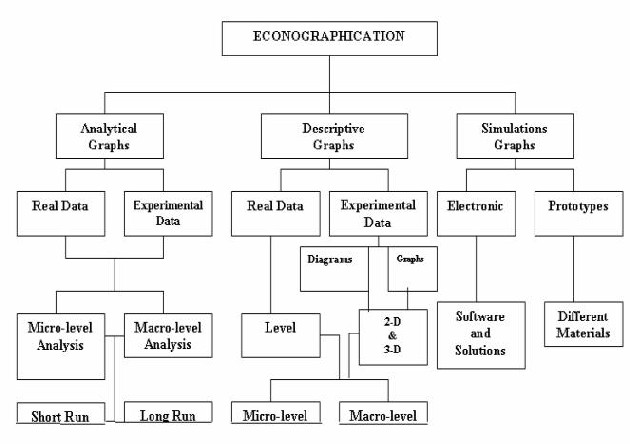
Econographicology is defined as an analytical tool whereby graphics are applied to the study of different research fields, with special emphasis in economics, finance and business. This new analytical tool will facilitate the understanding of any economic phenomenon from the graphical point of view. The Econographicology theoretical framework is divided into three large sections such as analytical graphics, descriptive graphics and graphics simulations. The analytical graphics can use real or experimental data under micro-level and macro-level of analysis in the short and long run (See Diagram 1).
The descriptive graphics used two types data: 1) the real data under micro and macro-level analysis in the short and long run, and; 2) experimental data. In turn, the experimental data is divided into two large sections: diagrams and graphs in 2-D and 3-D, which are also divided into Micro-level, and Macro-level analysis in the short and long run.
The last section is related to graphics simulations divided in two categories such as electronic and prototypes. In the case of the electronic area, it is based on the application of software and solutions. The idea to include prototypes in the graphics simulations seeks to facilitate the easy understanding in the teaching-learning-research process of any economic phenomenon (See Diagram 1). In conclusion, Econographicology can provide policy makers and researchers with an alternative area of research in economics applying new types of graphics.
Diagram 1: Econographicology Structure
Copyright © 2005-2013, Econographication Virtual Laboratory (EVL). All rights Reserved.